The 1889 Booth Wealth and Poverty Map of Bayswater
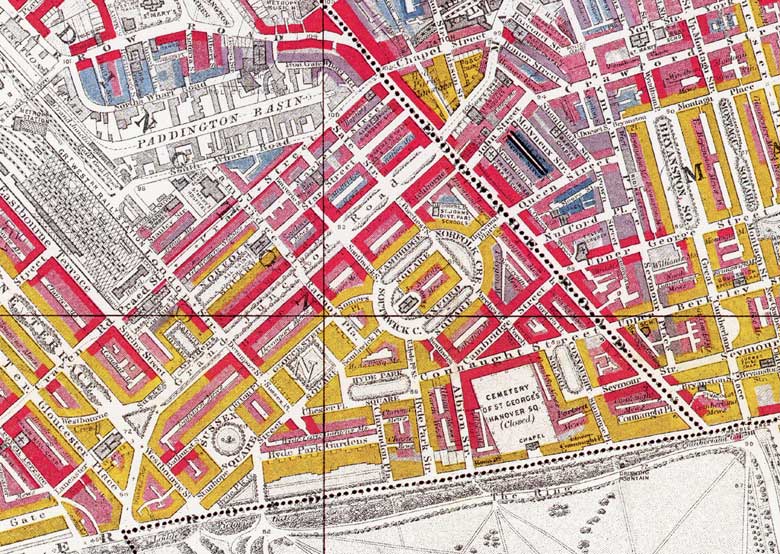
The Booth map of Bayswater is a great contrast to the Lisson Grove and Paddington Basin ones. Its colours are lighter - yellow and red, with some pink for Working Class Comfort in the inner courts, but none of the grinding poverty seen in the other two areas. At the end of the nineteenth century Bayswater was a prosperous area, as it is today. The contrast of rich and poor areas, especially when looking at on the coloured maps, is startling. The buildings on Harrow Road are Red but the streets around the Basin are all Blue.
 |
||
| Whole Map | Full Size | Full Size Map in New Window |
The houses facing Hyde Park are Yellow or Red. There are narrow strips of Blue behind the richer houses but these are probably stables with the coachmen living above.
| KEY | |
| Wealthy (three or more servants; houses rated £100 or more) | |
| Well to do (one or two servants) | |
| Working class comfort | |
| Comfort mixed with poverty | |
| Standard poverty | |
| Very poor | |
The lowest grade |
|
The contrast between the Bayswater and the Paddington Basin areas is stark. The narrow strip of Harrow Road is faced with Red but everything else round the basin is Blue. The builders of the new Bayswater estate (called Tyburnia until the unpleasant meaning of the name put people off) wanted to make their estate fashionable. They were on the wrong side of the Park, with splendid views, but at their backs was this workaday world of Paddington Basin and the Railway Station. Grand Junction Road was designed as a prestigious sweeping entry into the new estate and behind it was Praed Street as a barrier – a sort of cordon sanitaire to protect the fashionable from the grime of work.
London Topographical Society reproduced the maps for almost the whole of London on four large coloured sheets. There is a also fifth sheet, stretching up to Stoke Newington Church Street, N16, which is obtainable from the London School of Economics Library. Lay out these maps in one block and the yellows and reds, colours of light and wealth and warmth, are concentrated in smallish areas on the north-west sheet. All the others are drab purple and blue, with areas of dark blue and even black, the colours of cold and outer darkness.
Uses of the Booth Poverty Maps in this website.
